Dashboards
- 13 Feb 2024
- 8 Minutes to read
- Contributors

- Print
- DarkLight
- PDF
Dashboards
- Updated on 13 Feb 2024
- 8 Minutes to read
- Contributors
- Print
- DarkLight
- PDF
Article summary
Did you find this summary helpful?
Thank you for your feedback
Dashboards are graphical panels that use account balances or a number of transactions as their data source. The dashboard consists of one or more charts that can be displayed on a graph.
You can add a dashboard to a graph in two ways:
- Create a dashboard on the Graphs page
- Create a dashboard on the Actors bag page and add it to a graph
For more information on how to manage a dashboard, go to Manage dashboard.
Create a dashboard on the Graphs page
To create a dashboard on the Graphs page:
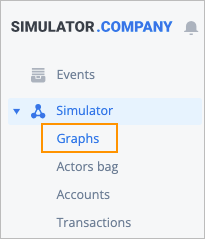
On the left navigation panel, click Graphs.
On the Graphs page that opens, double click the needed graph, and then:
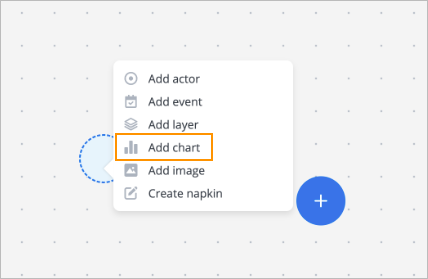
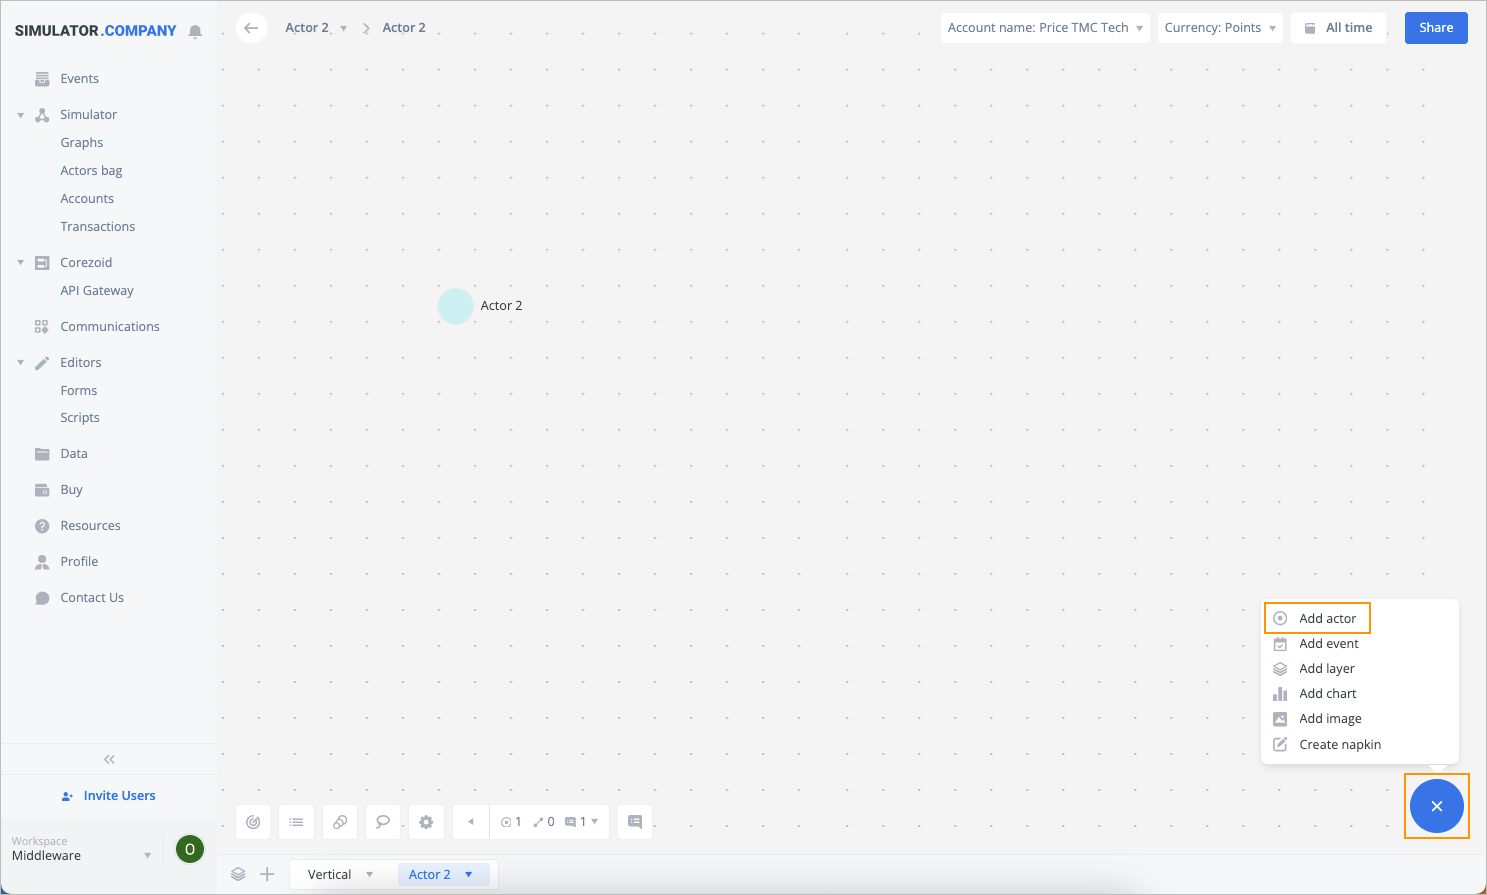
- In the needed place of the page, right-click, and then in the dropdown list, select Add chart.
- In the lower-right corner of the page, click the plus icon
 , and then in the dropdown list, select Add chart.
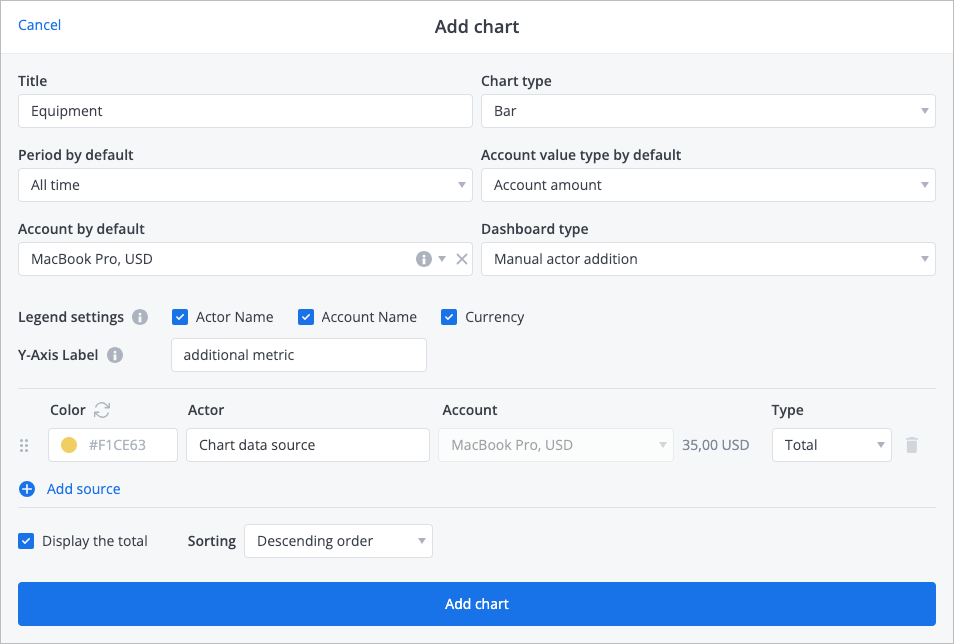
In the Add chart dialog that appears, enter or select the following:
Title.
Chart type: Bar, Line, Pie, Doughnut, Funnel, Table, Table.
Period by default: All time, Last 1 min, Last 10 min, Last hour, Today, Yesterday, Last week, Last month, Previous month, and Real-time.
Note: It is generated for the selected period that can be changed on the chart. Selecting Real-time makes the dashboard update in real-time mode.Account value type by default:
- Count of transactions: Transaction number counters for selected accounts.
- Account amount: Account balance (Debit, Credit, or Total).
(Optional) Account by default: Select the default account and currency.
Dashboard type:
- (Default) Manual actor addition: Add actors to the dashboard manually.
- Dynamic by actor filters: Account values are displayed based on the filters you've selected.
Legend settings: Select the checkboxes for the metrics you want to display (Actor name, Account name, Currency, Income type).
(Available only for Bar and Line chart types) Y-Axis Label: Vertical (Y) axis name, empty by default.
Note: You can configure the precision of account values display on a dashboard by entering the number of decimal positions these values will be rounded to. You can set this number in the Precision parameter in the Account-Currency configuration menu. For more information, go to Currency menu.(Available only for Dashboard type: Dynamic by actor filters) Select actor filters, Top: Select the filter for actor account values and the number of top filter results to display.
(Available only for Dashboard type: Manual actor addition) Color:
- Open the color picker palette, select a color for each actor (chart segment) or specify the color hex code, and then click Save. By default, a random color is set for dashboard actors.
- Regenerate all colors: Click the arrows icon to switch all actor colors to randomly generated ones.
(Available only for Dashboard type: Manual actor addition) Actor: Select the actor which account value will be displayed.
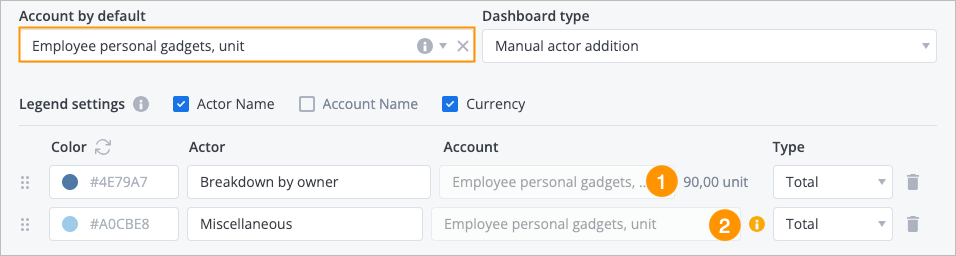
(Available only for Dashboard type: Manual actor addition) Account: Select the actor account which value will be displayed. If you select an Account by default and select the same account in this field, it will have the account value displayed to the right (1). If the selected account differs from the one listed in the Account by default, the "i" info icon will be displayed to the right of the field (2), informing that you must select an account specified as the default one to be displayed for the actor.
(Available only for Dashboard type: Manual actor addition) Type: Select the part of the account (Total, Debit, Credit).
(Optional) Add source: Add more actors with their accounts and types.
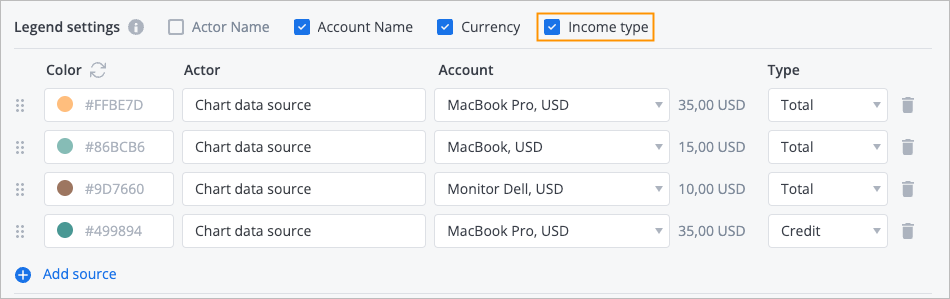
Note: You can add the same account to a dashboard as a source several times, but you need to select the Income type checkbox in the Legend settings section and a different Type each time you add the account:
Display the total:
- The checkbox is selected: The dashboard will display the total value as an automatically calculated sum of all added metrics.
- The checkbox is cleared: The dashboard won’t display the total value.
Sorting: Unsorted, Ascending order, Descending order.
Click Add chart.

 , and then in the dropdown list, select Add chart.


The added dashboard is on a graph with values displayed for each section.

You can add several dashboards on a graph.

Note: You can open the window with the relevant transaction history by clicking a dashboard sector. Also, you can hide the needed account metric by clicking the corresponding account on a chart.
Create a dashboard and add it to a graph
To create a dashboard on the Actors bag page and add it to a graph:
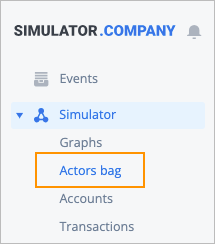
On the left navigation panel, click Actors bag.
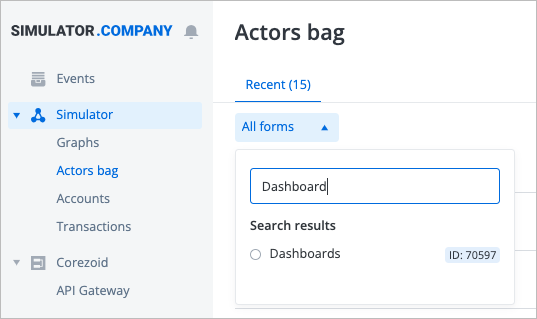
On the Actors bag page, click All forms, in the Search field that appears, enter the “Dashboard” word, and then click the result.
Note: You can also find dashboards by using the Search field or filter in the upper-right corener of the page.
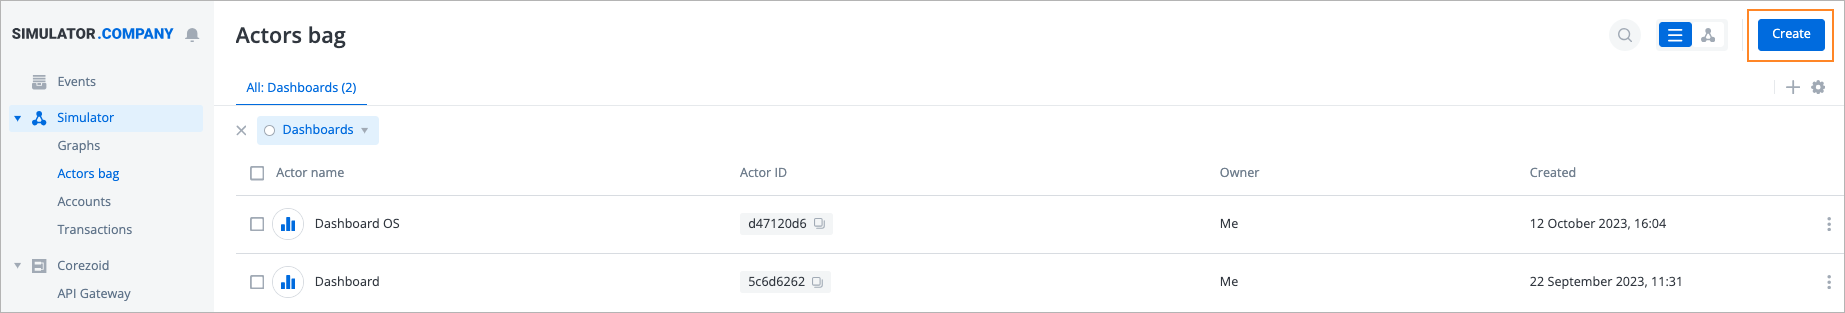
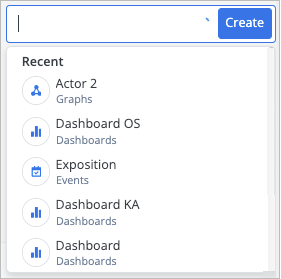
In the upper-right corner, click Create.
In the Add chart dialog that appears, enter or select the following:
Title.
Chart type: Bar, Line, Pie, Doughnut, Funnel, Table, Table.
Period by default: All time, Last 1 min, Last 10 min, Last hour, Today, Yesterday, Last week, Last month, Previous monthand Real-time.
Note: It is generated for the selected period that can be changed on the chart. Selecting Real-time makes the dashboard update in real-time mode.Account value type by default:
- Count of transactions: Transaction number counters for selected accounts.
- Account amount: Account balance (Debit, Credit, or Total).
(Optional) Account by default: Select the default account and currency.
Dashboard type:
- (Default) Manual actor addition: Add actors manually.
- Dynamic by actor filters: Account values are displayed based on the filters you've selected.
Legend settings: Select the checkboxes for the metrics you want to display (Actor name, Account name, Currency, Income type).
(Available only for Bar and Line chart types) Y-Axis Label: Vertical (Y) axis name, empty by default.
Note: You can configure the precision of account values display on a dashboard by entering the number of decimal positions these values will be rounded to. You can set this number in the Precision parameter in the Account-Currency configuration menu. For more information, go to Currency menu.(Available only for Dashboard type: Dynamic by actor filters) Select actor filters, Top: Select the filter for actor account values and the number of top filter results to display.
(Available only for Dashboard type: Manual actor addition) Color:
- Open the color picker palette, select a color for each actor (chart segment) or specify the color hex code, and then click Save. By default, a random color is set for dashboard actors.
- Regenerate all colors: Click the arrows icon to switch all actor colors to randomly generated ones.
(Available only for Dashboard type: Manual actor addition) Actor: Select the actor which account value will be displayed.
(Available only for Dashboard type: Manual actor addition) Account: Select the actor account which value will be displayed.
(Available only for Dashboard type: Manual actor addition) Type: Select the part of the account (Total, Debit, Credit).
(Optional) Add source: Add more actors with their accounts and types.
Note: You can add the same account to a dashboard as a source several times, but you need to select the Income type checkbox in the Legend settings section and a different Type each time you add the account:
Display the total:
- The checkbox is selected: The dashboard will display the total value as an automatically calculated sum of all added metrics.
- The checkbox is cleared: The dashboard won’t display the total value.
Sorting: Unsorted, Ascending order, Descending order.
Click Add chart.

On the left navigation panel, click Graphs.
On the Graphs page that opens, double click the needed graph, and then:
- In the needed place of the page, right-click, and then in the dropdown list, select Add actor.
- In the lower-right corner of the page, click the plus icon , and then in the dropdown list, select Add actor.
In the dropdown list that appears, select the needed dashboard actor.


The added dashboard is on a graph with values displayed for each section.

Quickly view and configure a dashboard in the account menu
You can quickly view and configure the Line type dashboard for an account by selecting Show dashboard in the account menu.

Manage dashboard
You can manage a dashboard:
Manage dashboard on the Graphs page
Note: If you have access to a dashboard but don’t have access to its accounts, you can view a dashboard with all its accounts.
You can manage a dashboard on the Graphs page in the following way:
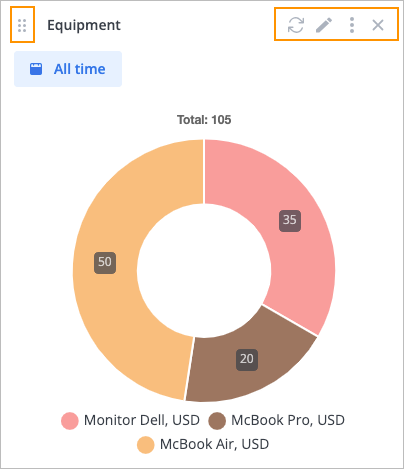
Resize the dashboard by dragging and dropping the dashboard border
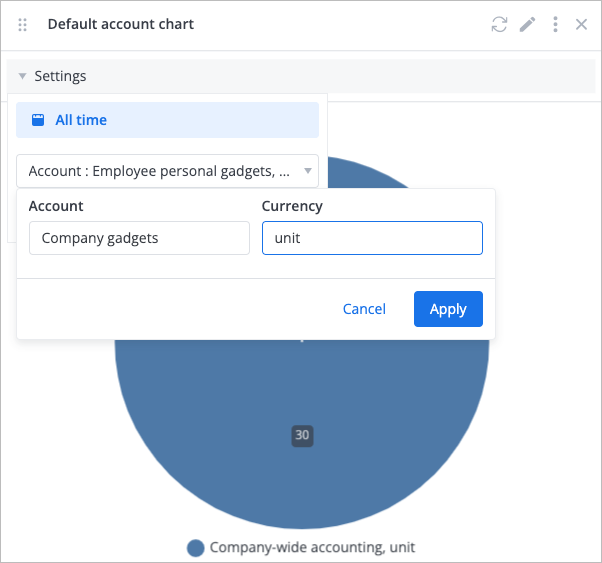
In the Settings menu, select the time interval, switch between different accounts (if the Account by default was selected) of the actor you've selected in the Actor field and between the amount and transaction count values.
Update the dashboard by clicking the update icon

Edit the dashboard by clicking the edit icon

Move the dashboard to another place on a graph by dragging it by the placing icon

Close the dashboard by clicking the cross icon

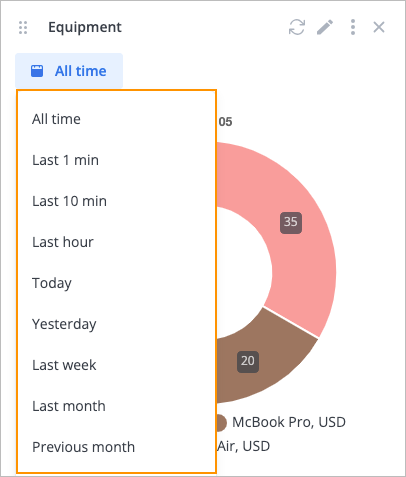
See the dashboard statistics for the needed period by clicking All time and selecting a time interval
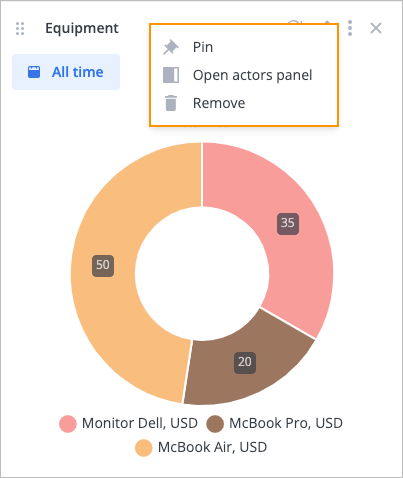
Pin and remove the dashboard or open the dashboard actor’s panel by clicking the options icon


Manage dashboard on the Actors bag page
To manage a dashboard on the Actors bag page
On the left navigation panel, click Actors bag.
On the Actors bag page, click All forms, in the Search field that appears, enter the “Dashboard” word, and then click the result.
Note: You can also find dashboards by using the Search field or filter in the upper-right corener of the page.
In the list of dashboards that appears, select the needed one.
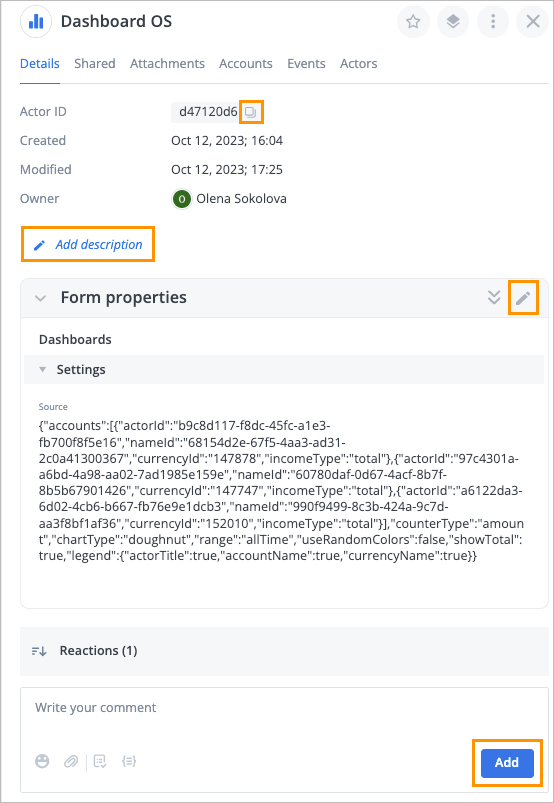
On the Details tab that opens by default, you can:
- Copy the dashboard ID by clicking the copy icon
 next to the ID
 - Add a description by clicking Add description
- Edit dashboard properties by clicking the edit icon on the right side of the Form properties
- Add a comment by clicking Add
- Copy the dashboard ID by clicking the copy icon
 next to the ID
Note: For more information about how to edit an actor on the Actors bag page, go to Accounts.

Was this article helpful?