- 21 Dec 2023
- 1 Minute to read
- Contributors

- Print
- DarkLight
- PDF
Activity Monitor
- Updated on 21 Dec 2023
- 1 Minute to read
- Contributors

- Print
- DarkLight
- PDF
Overview
The Activity Monitor helps you observe activity statistics of your Processes in the selected Company within the chosen timeframe, focusing on specific categories such as State changes, Tasks, and Traffic.
With the Activity Monitor, you can:
- Determine the most active Processes
- View max values for tasks, state changes, and amount of traffic
- Have a clear vision of your Company’s activity
View activity statistics
When working with your Processes and other objects, you can view your Company’s activity statistics. To do so:
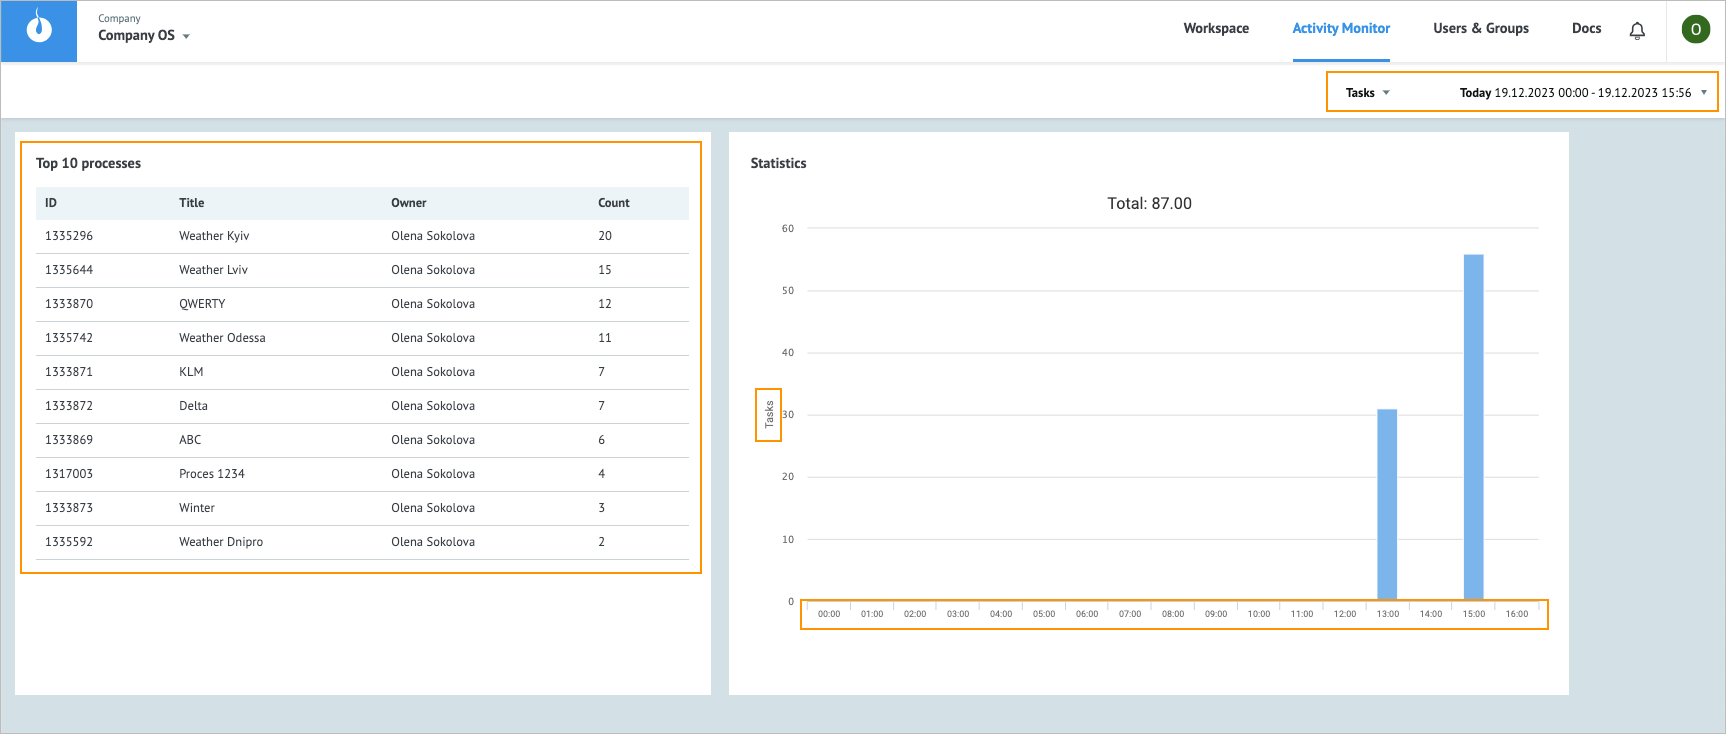
On the Workspace tab of your Company, click the Activity Monitor tab.

On the Activity Monitor tab:
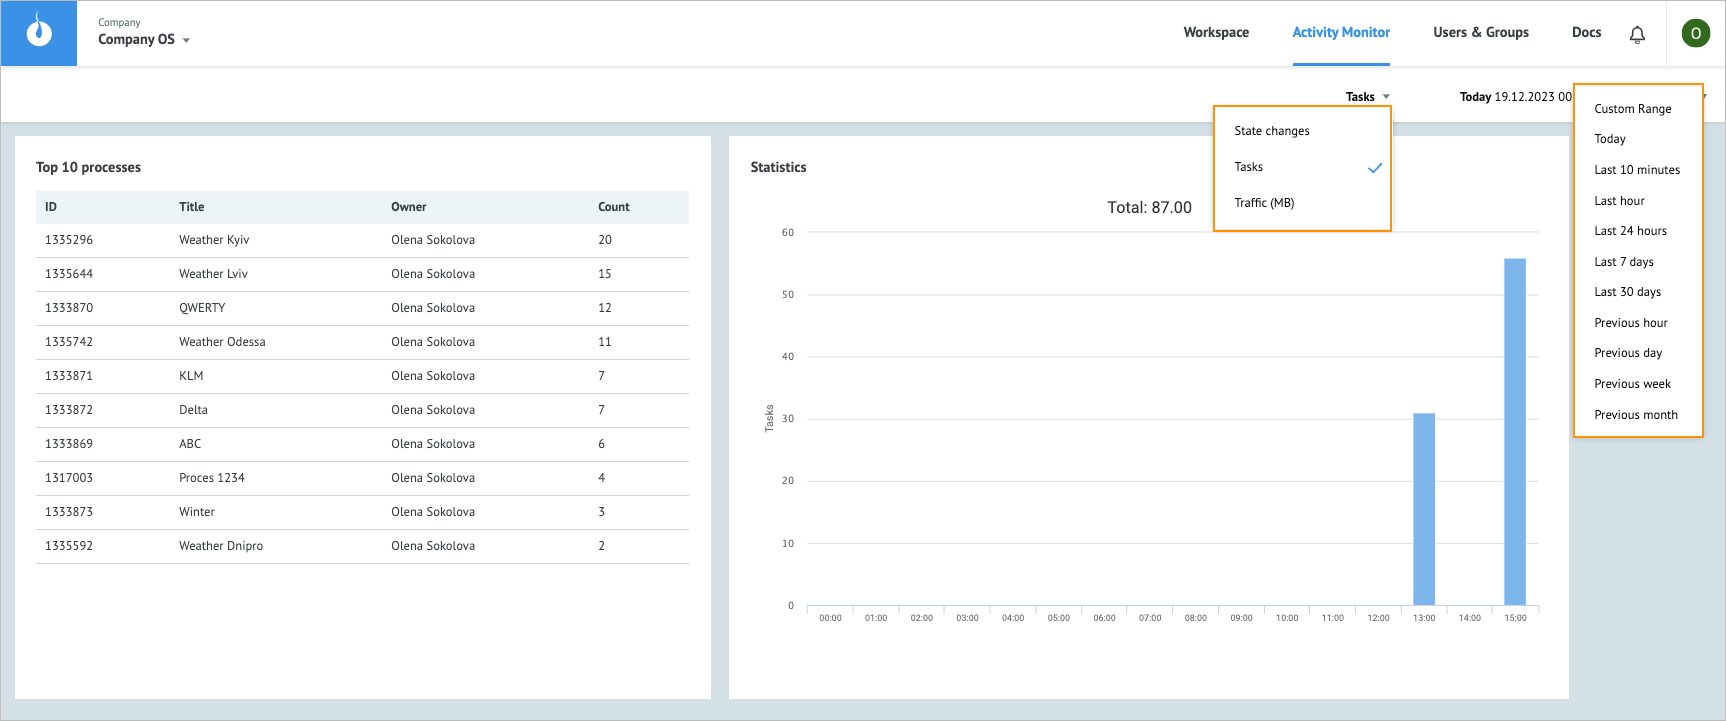
- In the Task dropdown list, select the needed category: State changes, Tasks, or Traffic.
- In the interval dropdown list, select the needed period.

On the left side, you can see the list of ten Processes with the highest activity. On the right side, you can see statistics as a bar chart according to the selected category and interval.
Additional actions
You can perform additional actions on the Activity Monitor tab:
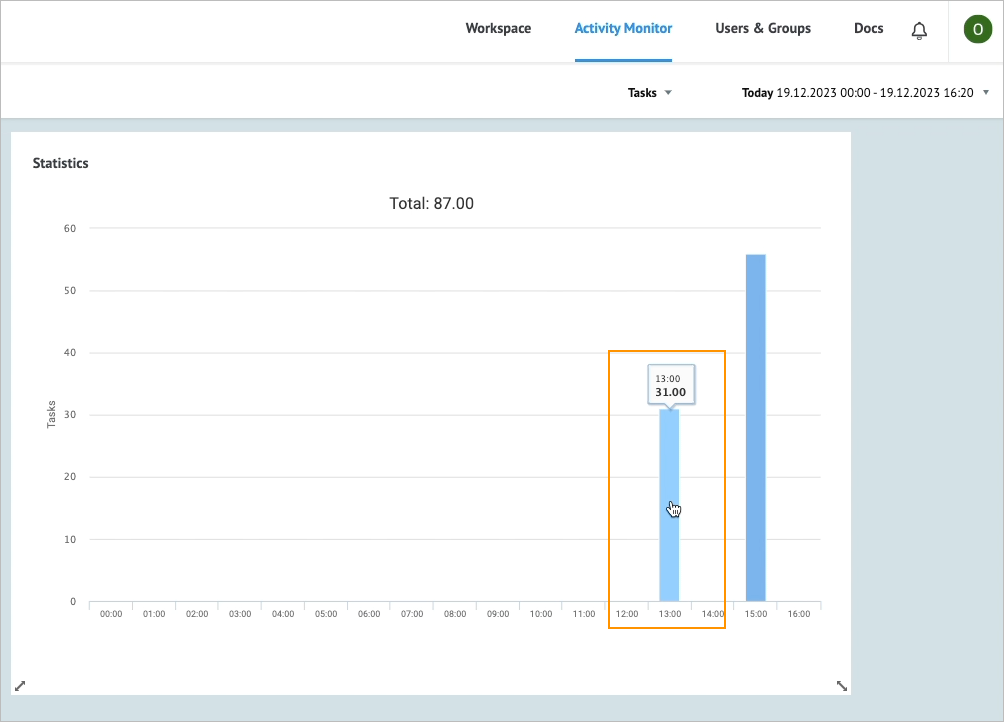
Hover over the needed bar on the statistics chart and view the exact number of tasks processed within the displayed interval.

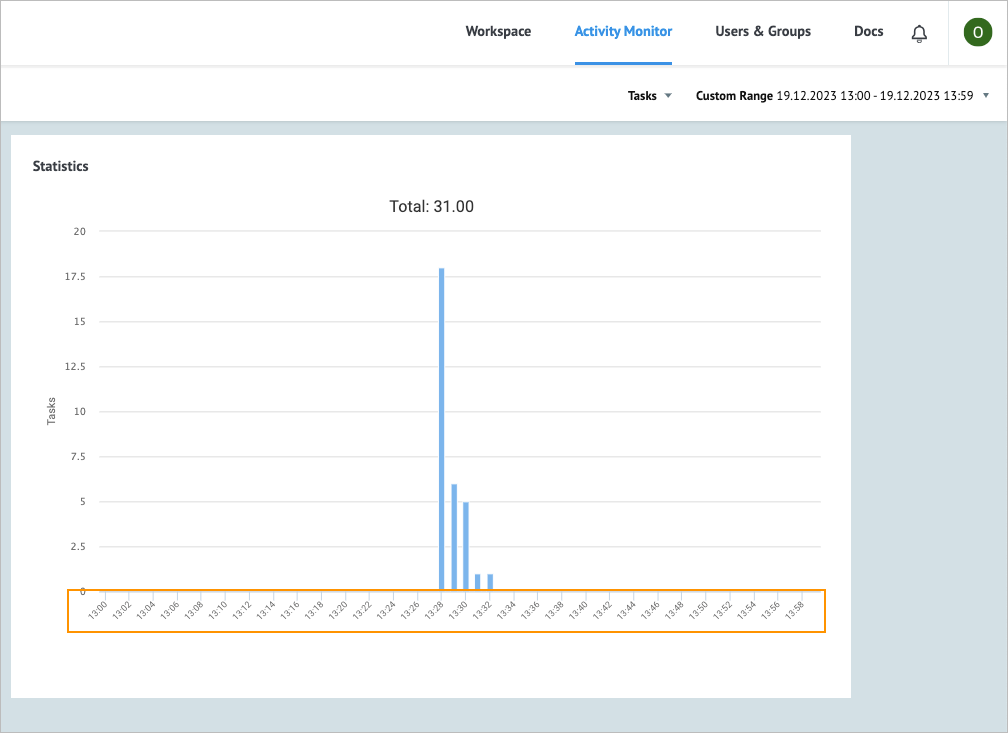
Click the needed bar on the statistics chart and view the bar chart with a smaller interval.

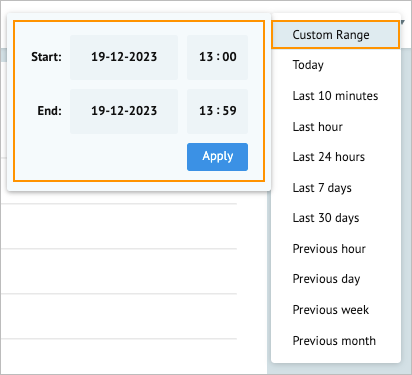
Note: You can also set a smaller interval by selecting it in the Custom Range menu of the interval dropdown list.

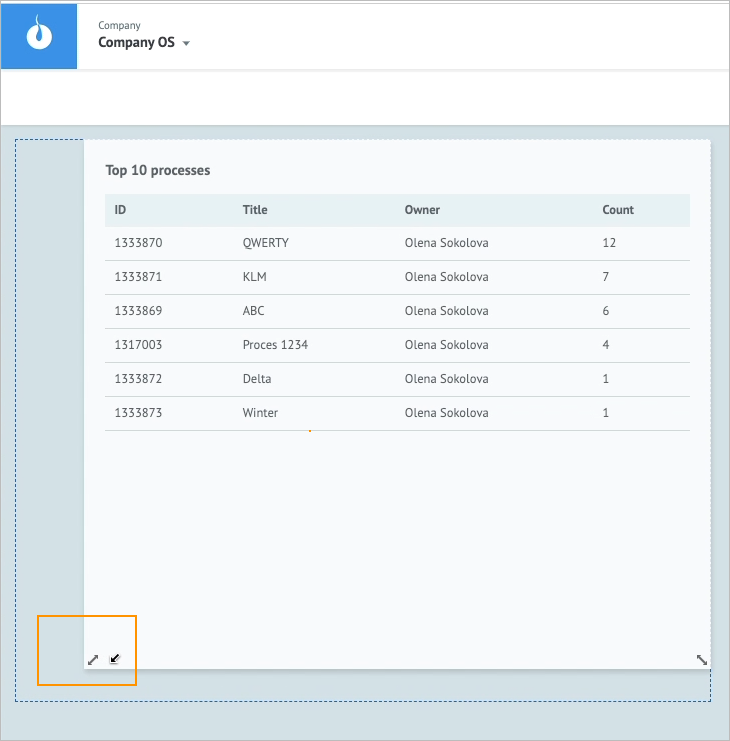
Resize the Processes or Statistics widget by dragging and dropping the widget lower-left or lower-right corner.

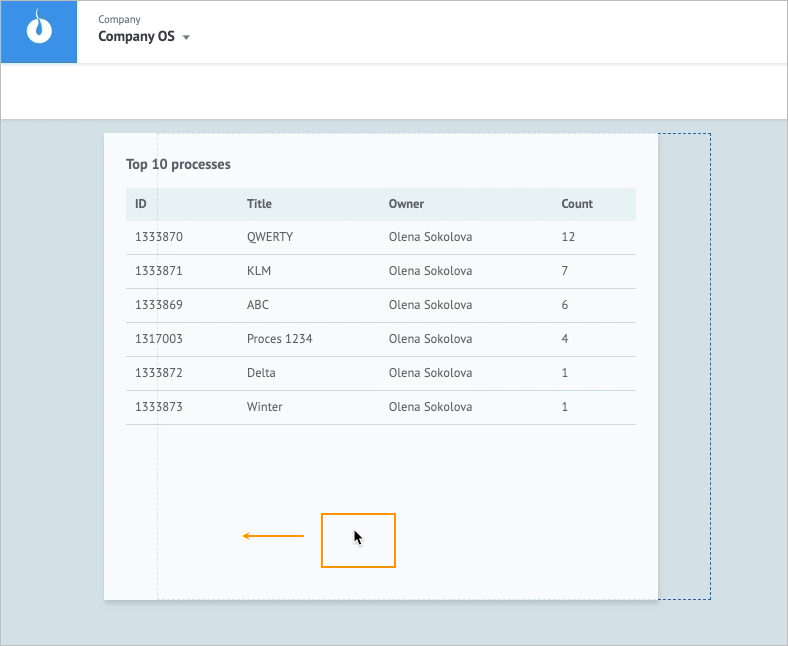
Move the Processes or Statistics widget to the needed place on the tab by dragging and dropping it.

On the Processes widget, click the needed Process line and view the Process in a new tab where you can find more details about the tasks of the Process. For more information on tasks in a Process, go to Task details and Manage task.
