Debug Process
- 12 Dec 2023
- 1 Minute to read
- Contributors

- Print
- DarkLight
- PDF
Debug Process
- Updated on 12 Dec 2023
- 1 Minute to read
- Contributors
- Print
- DarkLight
- PDF
Article Summary
Share feedback
Thanks for sharing your feedback!
You can debug a Process to see the details of each stage and to make sure all the internal stages work properly. To do so:
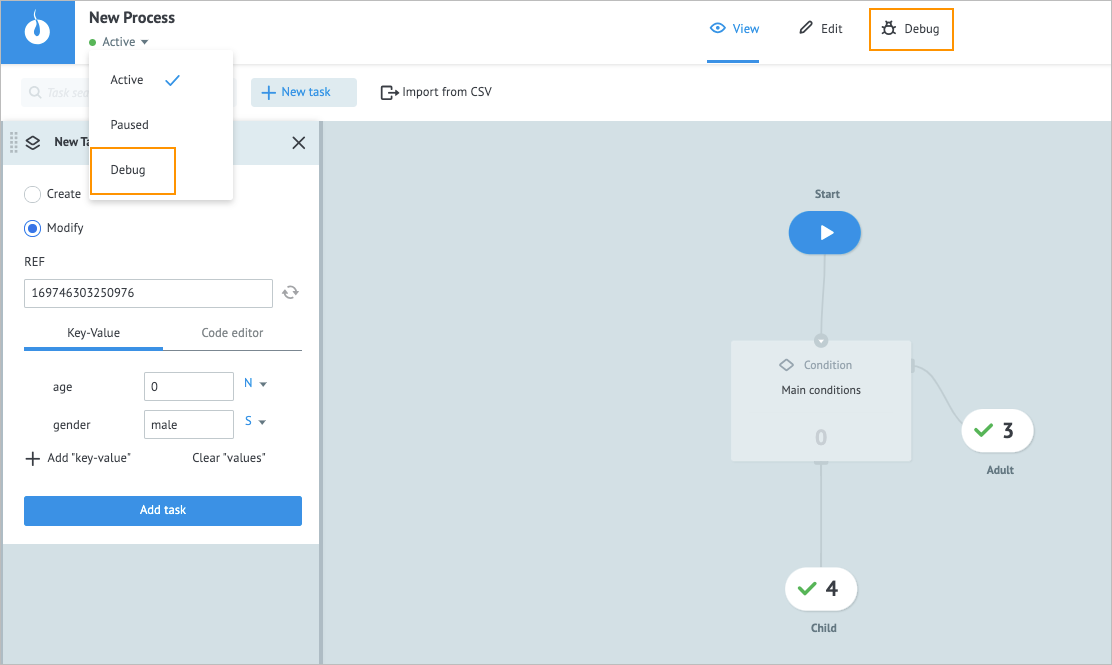
Open your Process, click the expand icon next to the status name, from the dropdown list, select Debug, and then on the upper panel, click Debug.
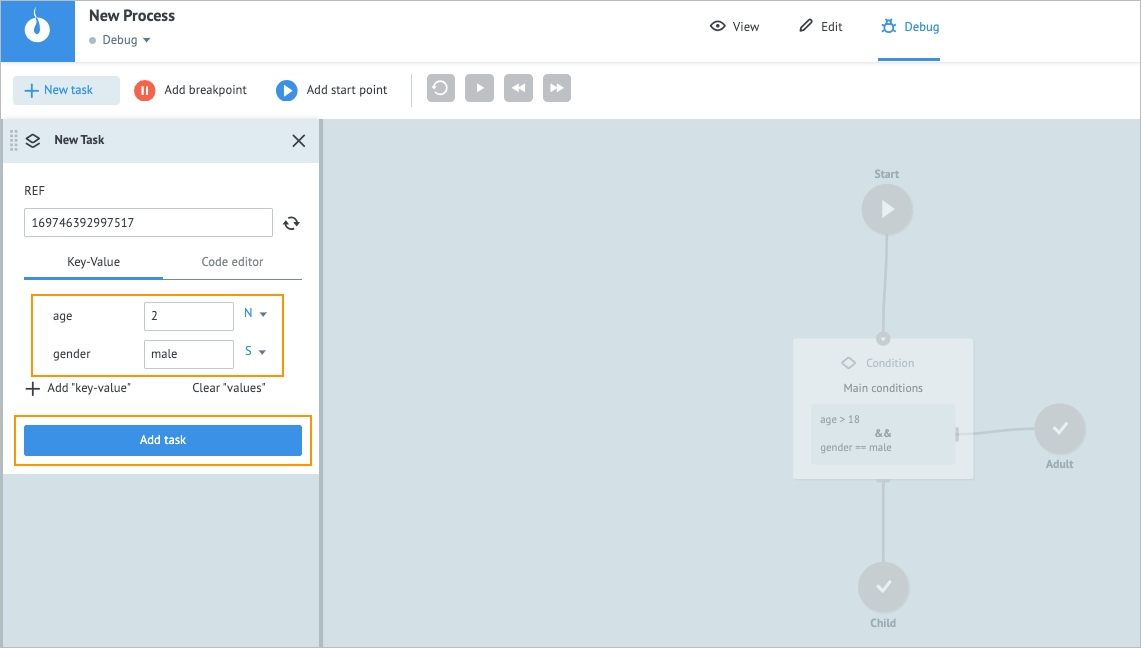
In the New Task dialog of the Debug mode, enter task parameters, and then click Add task.
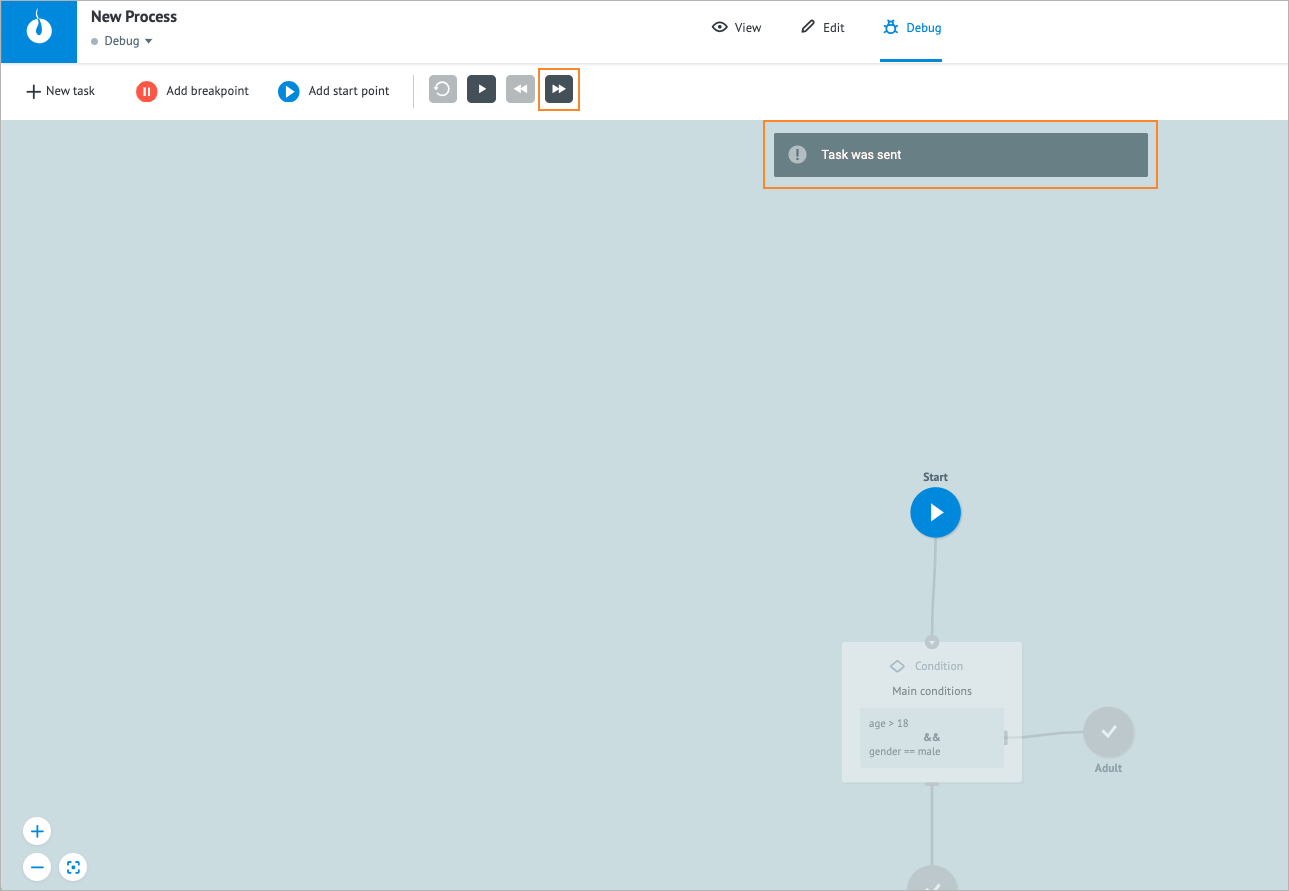
After the message “Task was sent” appears, click the Forward button
 .
.


You can see the first stage of your task in the Process, and the details appear on the Result of the execution of the last tact panel.
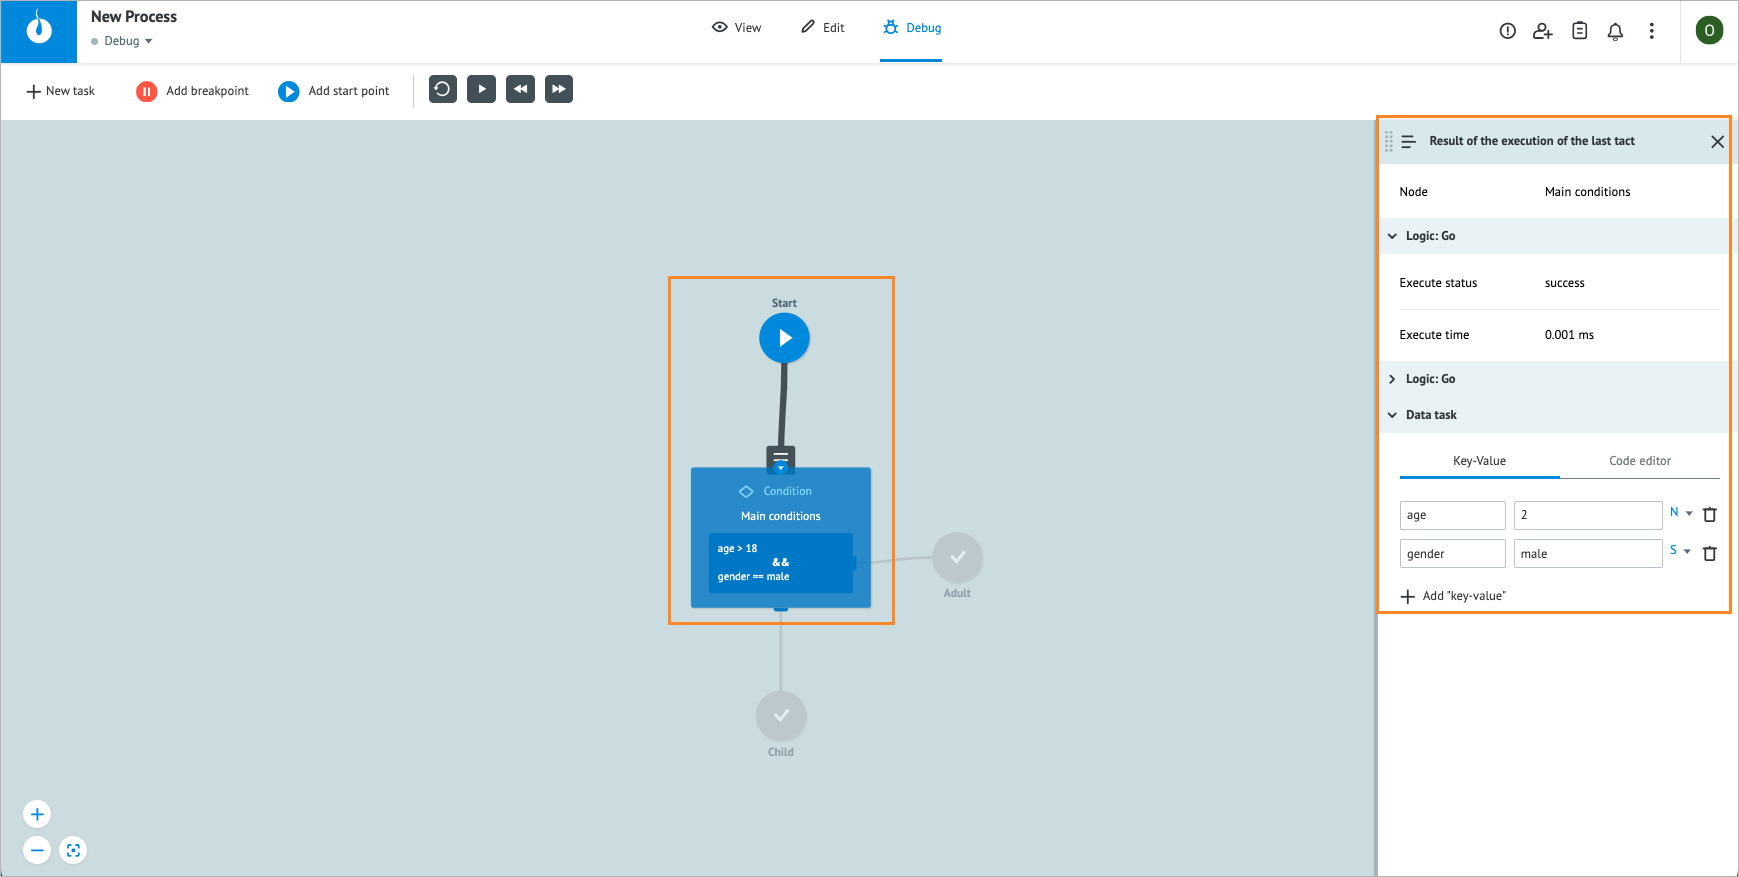
Task parameters can be edited directly in the debugging process.
Every time you click the Forward button  , the next stage details appear on the right panel, and you can check if it works properly step by step. You can also use other buttons on the upper panel:
 Repeat button: To repeat the needed stage.
 Play button: To play the whole Process.
 Back button: To go one step back.
 Repeat button: To repeat the needed stage.
 Play button: To play the whole Process.
 Back button: To go one step back.
You can modify the Process debugging by adding:
 Add breakpoint button: To add the final point to the needed place in a Process.
 Add start point button: To add the start point to the needed place in a Process.
 Add breakpoint button: To add the final point to the needed place in a Process.
 Add start point button: To add the start point to the needed place in a Process.
To remove the breakpoint or start point, click it and press the Delete button on your keyboard.
Below, you can see an example of debugging a Process with delay.

Was this article helpful?