State Diagram
- 19 Dec 2023
- 3 Minutes to read
- Contributors

- Print
- DarkLight
- PDF
State Diagram
- Updated on 19 Dec 2023
- 3 Minutes to read
- Contributors
- Print
- DarkLight
- PDF
Article Summary
Share feedback
Thanks for sharing your feedback!
Overview
State Diagrams are commonly used to track states of an object and store operational data. For example, in small to big enterprises, State Diagrams can be used to:
- Track and manage various user states
- Order medications, food, and other items on schedule
- Share information on promos, advertising news, discounts, and so on
In Corezoid, State Diagrams have the following capabilities:
- Accounting: Accounting of object states.
- Data storage: Stores data on objects in nodes.
- Data retrieval: Retrieves data on objects using the CONV parameter.
- Flexibility: Has no restrictions on the number of times it is applied in a Process.
A State Diagram can have common user states including New, Active, and Non-active.
State Diagrams like Processes work with data in tasks. To view tasks used in a State Diagram, you can switch to the View mode and select the specific node within the State Diagram.
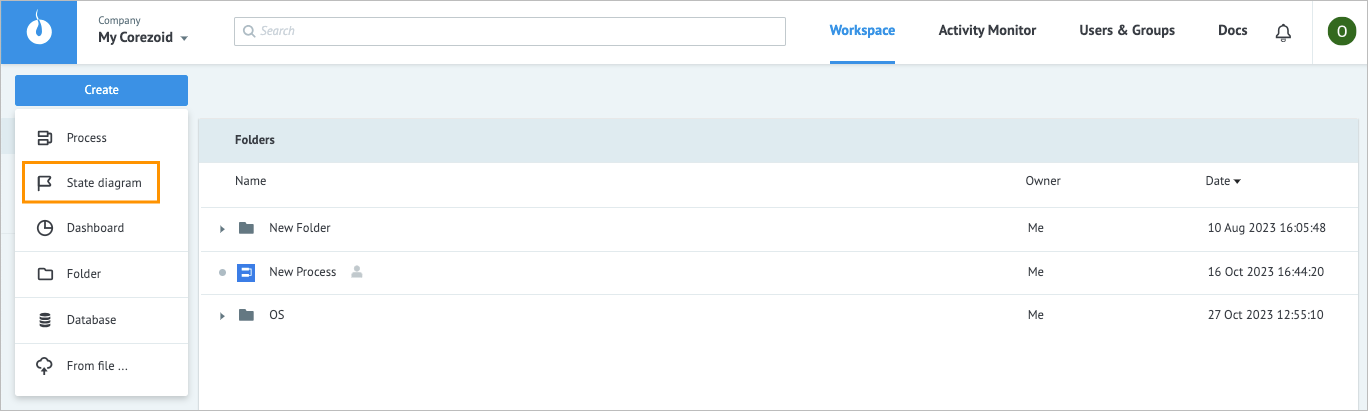
Create State Diagram
To create a State Diagram:
On the Workspace tab, click Create, and then in the dropdown list, click State Diagram.
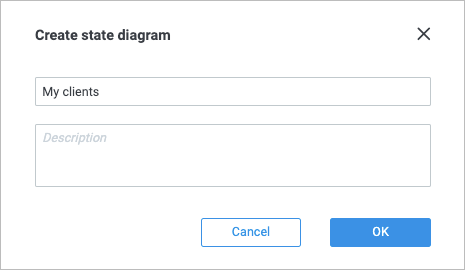
In the Create state diagram dialog that opens, enter a State Diagram name and description (optional), and then click Ok.
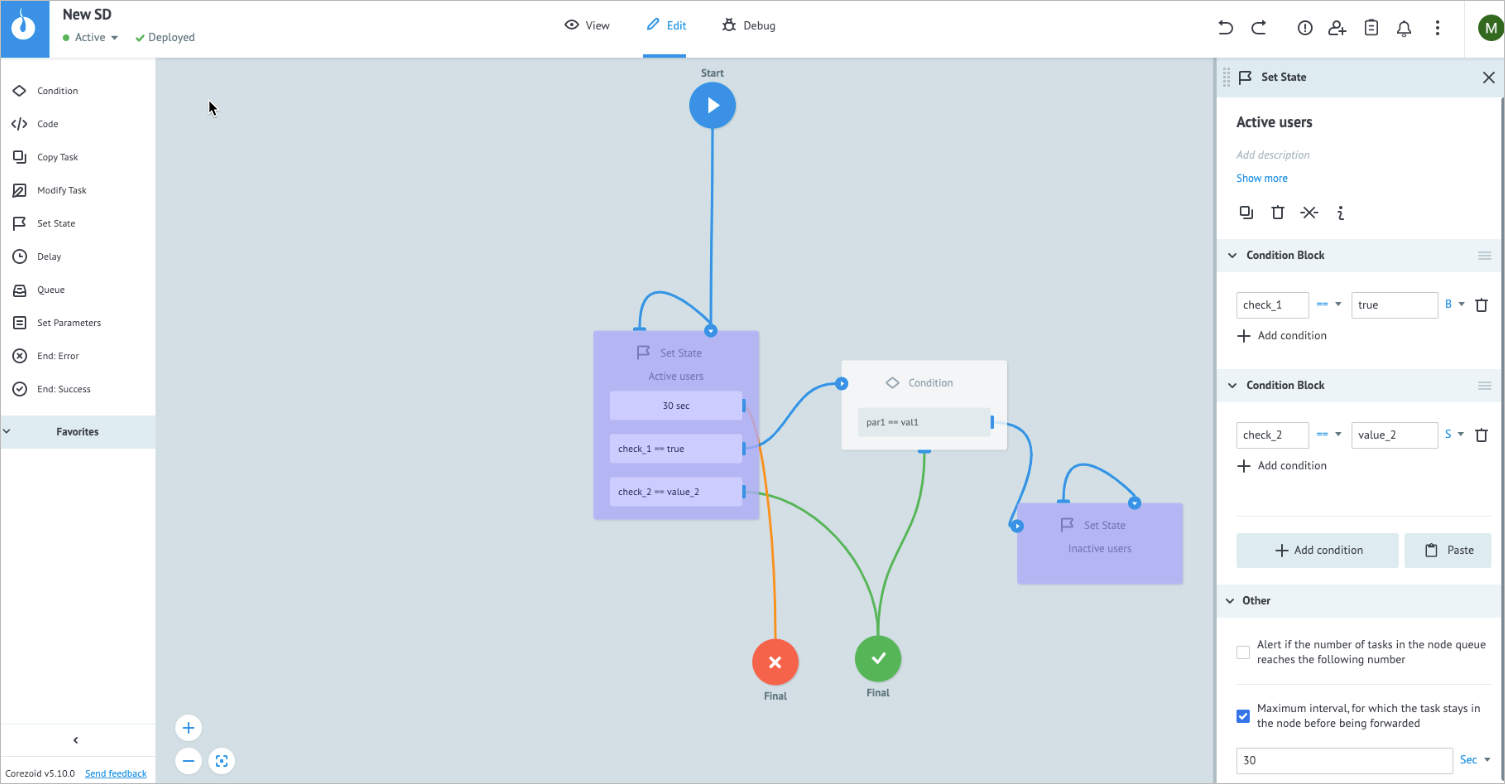
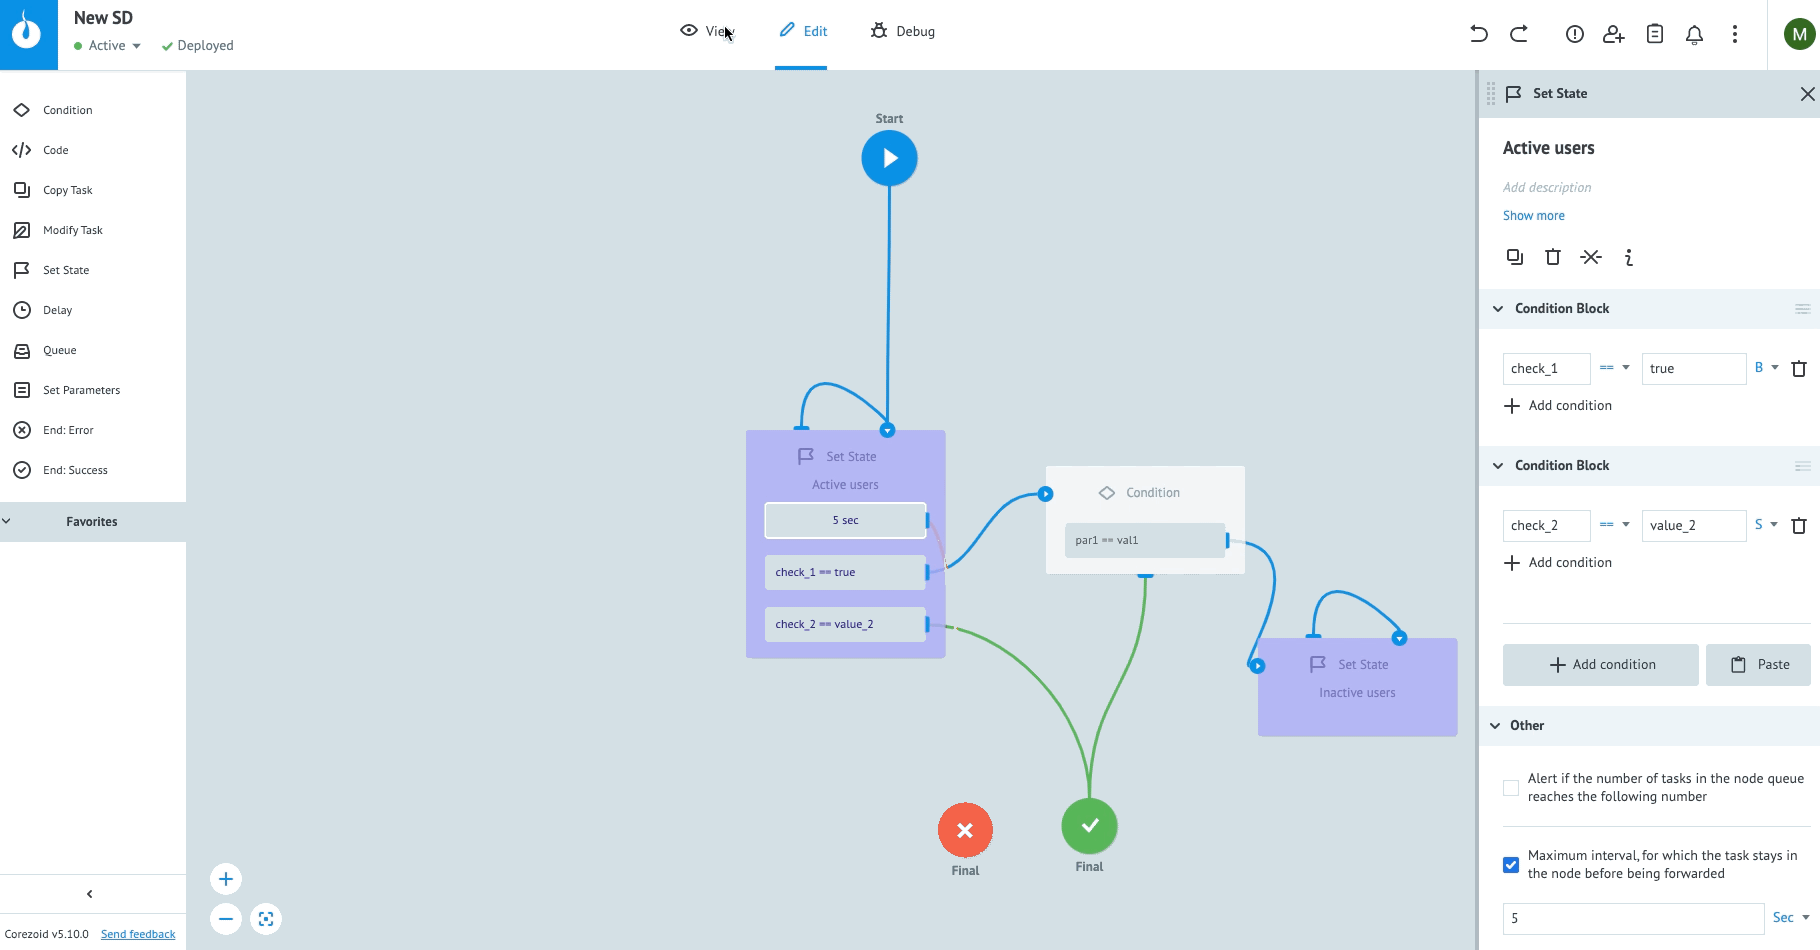
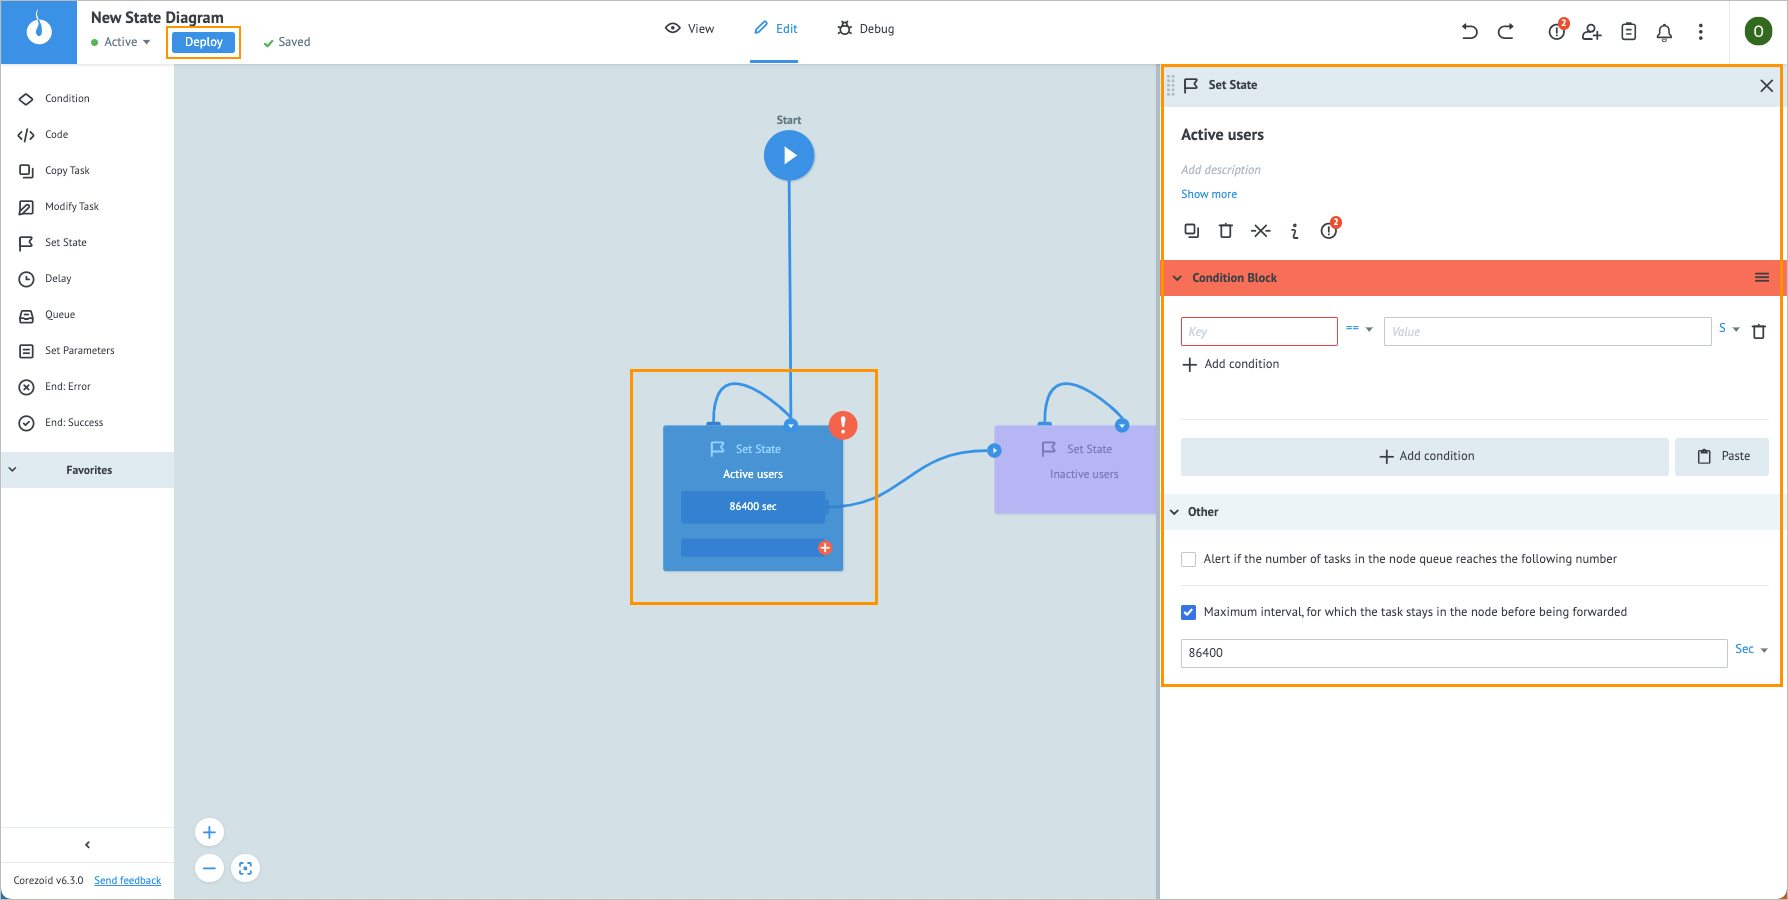
(Optional) On the created State Diagram page that opens, click the Active users state:
Modify the state name and add a description.
In Condition block, enter:
- Key: Key to specify variables; use curly brackets to enter the key. For example, {{age}}.
- Comparison operator: The way the key and the value are compared:
- Equal to (==)
- Not equal (!=)
- More than (>)
- More than or equal to (>=)
- Less than (<)
- Less than or equal to(<=)
- Regular Expression (RegExp)).
- Value: Value to compare; use curly brackets to enter the value. For example, {{age}}.
- Type of data:
- String (S)
- Number (N)
- Boolean (B)
- Array (A)
- Object (O)
Note: For more information on how to add a condition, go to Condition.
In Other:
- Select the Alert if the number of tasks in the node queue reaches the following number checkbox and enter the needed number of tasks in the field that appears below.
- Select the Maximum interval, for which the task stays in the node before being forwarded checkbox, and enter the amount of time a task is allowed to be in the node in seconds, minutes, hours, and days.
Note: The checkbox is selected by default and has a minimum value of 30 seconds. You can set a shorter interval by using the Unixtime function.
(Optional) Configure other states of the State Diagram in a way similar to the one described in step 3.
In the upper-left corner of the page, click Deploy.


If you encounter any errors during the State Diagram creation, the warning icon  shows the error number in a red dot in the upper-right corner of the page. Click the warning icon to view error details.

The new State Diagram has been created, and now you can add the needed nodes to it. You can use the following nodes in a State Diagram:
- Condition: To make decisions and control the flow of tasks based on specific conditions.
- Delay: To introduce a delay in the execution of a task within the node. You can specify the desired time interval (delay) in the Limit the time of the task in the node field.
- Set Parameters: To add new parameters or modify existing parameters within tasks and to apply various functions to the parameters, allowing for data manipulation and transformation.
- Code: To write a custom code that will be applied to a task in a State Diagram.
- Queue: To store data in a node.
- Copy Task: To copy a task from one Process or State Diagram to another without interrupting the original Process or State Diagram.
- Set State: To track and manage the states of objects in your State Diagram. It can store operational data related to the objects and facilitate state transitions based on specific criteria.
- Modify Task: To modify a task in another process by reference.
For more information on how to add a node to a State Diagram, go to Add node.
Was this article helpful?