Dashboard
- 19 Dec 2023
- 2 Minutes to read
- Contributors

- Print
- DarkLight
- PDF
Dashboard
- Updated on 19 Dec 2023
- 2 Minutes to read
- Contributors
- Print
- DarkLight
- PDF
Article Summary
Share feedback
Thanks for sharing your feedback!
Overview
A dashboard is a tool in Corezoid designed for collecting and visualizing statistics and reports related to Processes and State Diagrams. Dashboards present data in the form of charts, allowing users to gain insights from the data visually. The charts, in turn, use data from nodes of built Processes and State Diagrams. The tasks in these nodes (counters) serve as the source of data (metrics) of the charts.
Create dashboard
To create a dashboard:
On the Workspace tab, click Create, and then in the dropdown list, select Dashboard.
Note: You can import a dashboard from a json file that contains a folder with a dashboard and related processes and charts.To do so, in the dropdown list, select From file and then choose the file from your device.
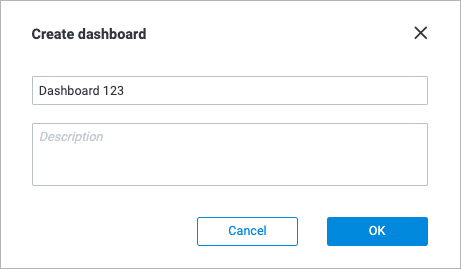
In the Create dashboard dialog that opens, enter a dashboard name and description (optional), and then click Ok.
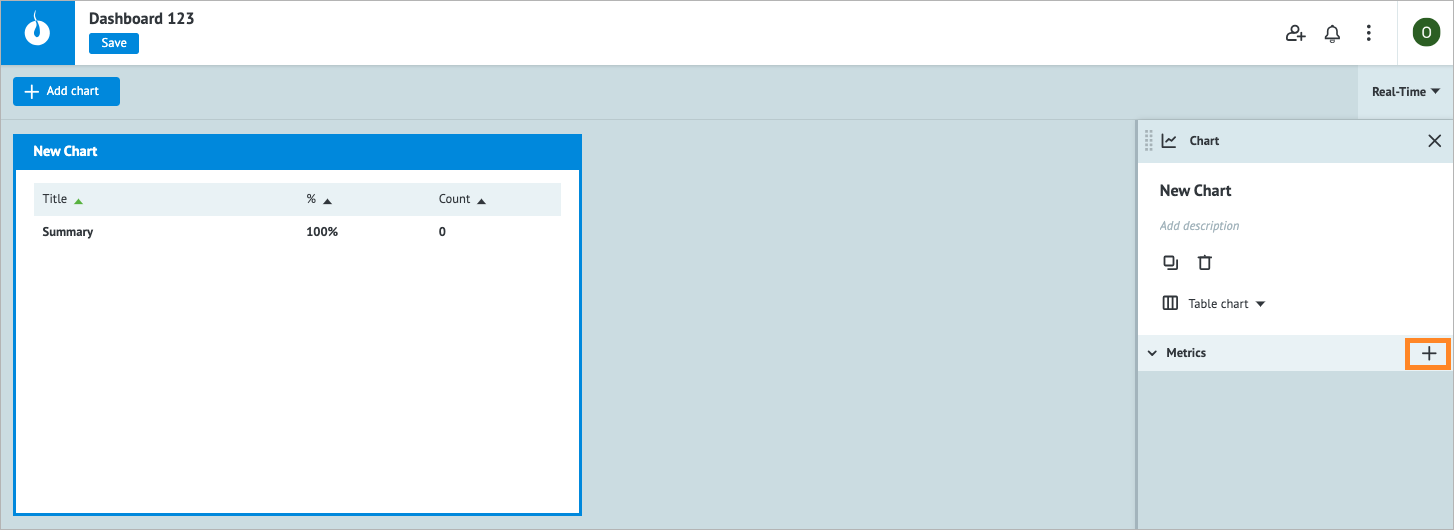
On the Chart details panel of the created dashboard page, click the plus icon + next to Metrics.
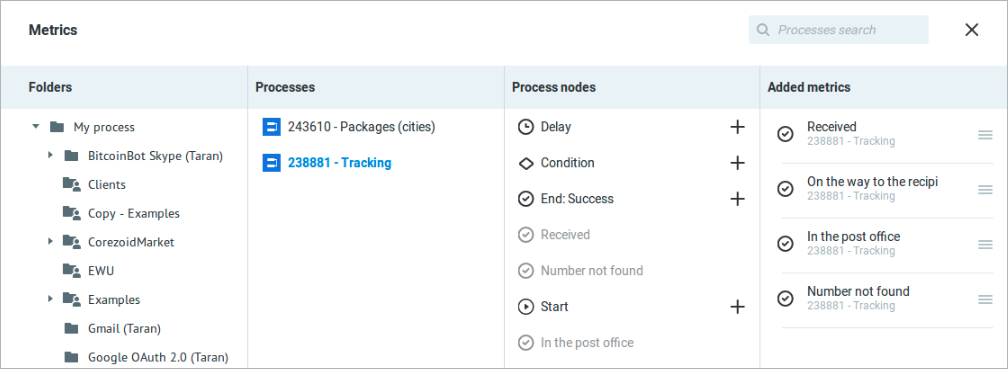
In the Metrics table, select the needed data source for the chart:
- Folders: A list of folders with processes
- Processes: Processes located in the selected folder
- Process nodes: Nodes of the selected process.
Note: Click the plus icon + to add a node to the chart. - Added metrics: Lists the nodes added to the dashboard
Note: After you have selected the needed data, in the upper-right corner of the table, click the close icon
 .
.
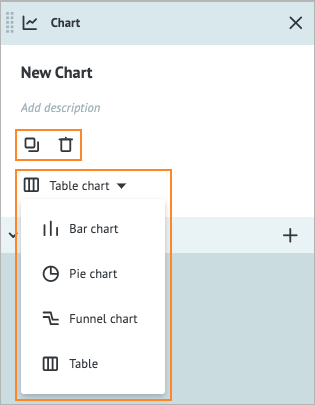
(Optional) On the Chart details panel:
- Click Table chart, and then select the needed chart type (Bar chart, Pie chart, Funnel chart).
- Click the copy icon to make a copy of the chart.
- Click the delete icon to delete the chart.
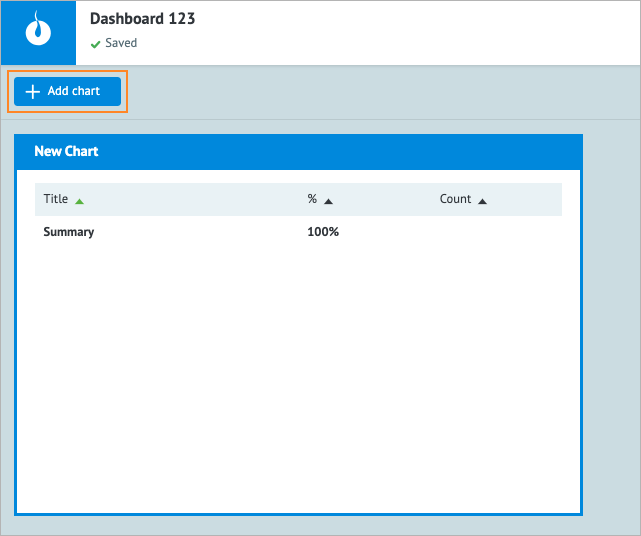
(Optional) In the upper-left corner of the created dashboard page, click + Add chart and customize a new chart by following steps 3-6.
Note: You can add multiple charts to your dashboard.
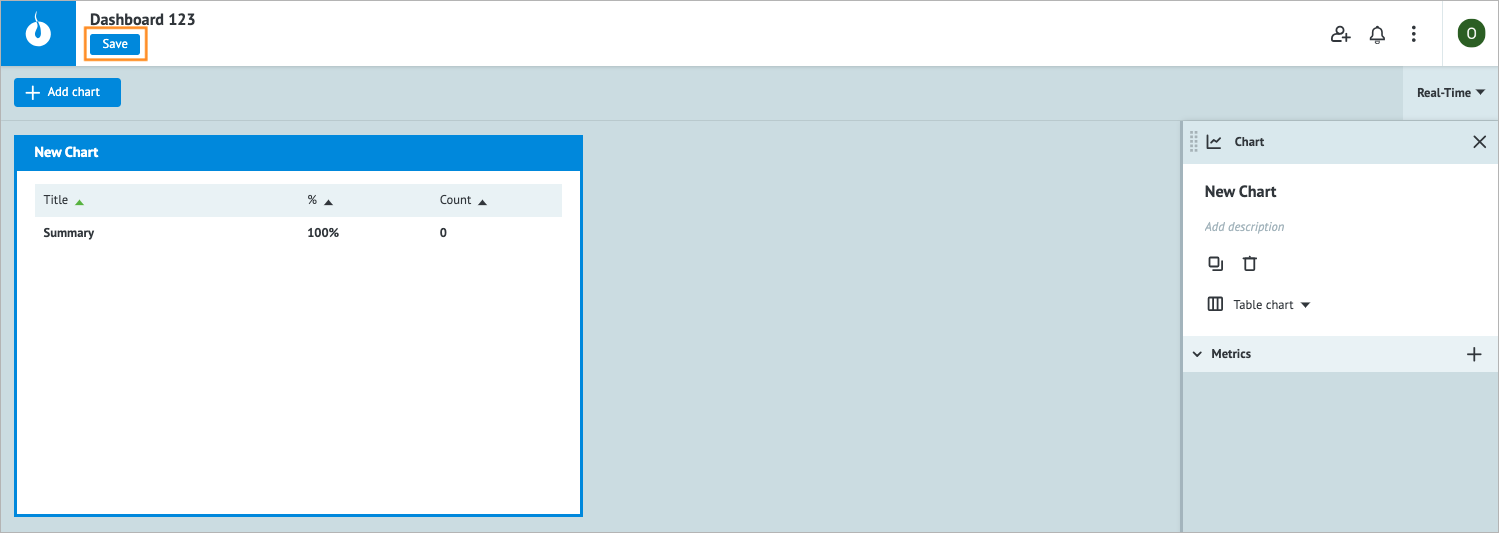
In the upper-left corner, click Save.


 .
.


You’ve created the dashboard, and now can easily customize it.
Additional actions
Select time range
You can select the needed time range for your dashboard by clicking Real-Time in the upper-right corner of the page.
The Real-Time mode works only for the End node where the tasks are accumulated and for the Waiting for Callback, Delay and Set State nodes (in a State Diagram) where the tasks are delayed for the time specified in the Process. Nodes of other types do not accumulate tasks, resulting in empty chart data when the Real-Time mode is selected.
Resize chart
Adjust the size of a chart by moving the cursor to its left or right side and setting the desired size.
Add link to chart
If your data has a hierarchical structure with nested elements, you can display detailed information by linking the chart to another dashboard that provides in-depth metric details.
To add a link to a chart:
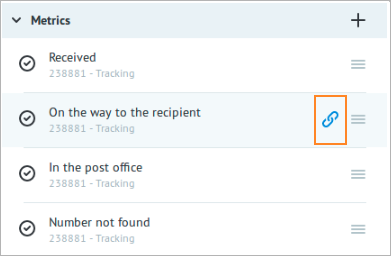
In Metrics of the Chart details panel, click the link icon
 .
.
In the Linked chart table, select the needed dashboard and a chart in it.
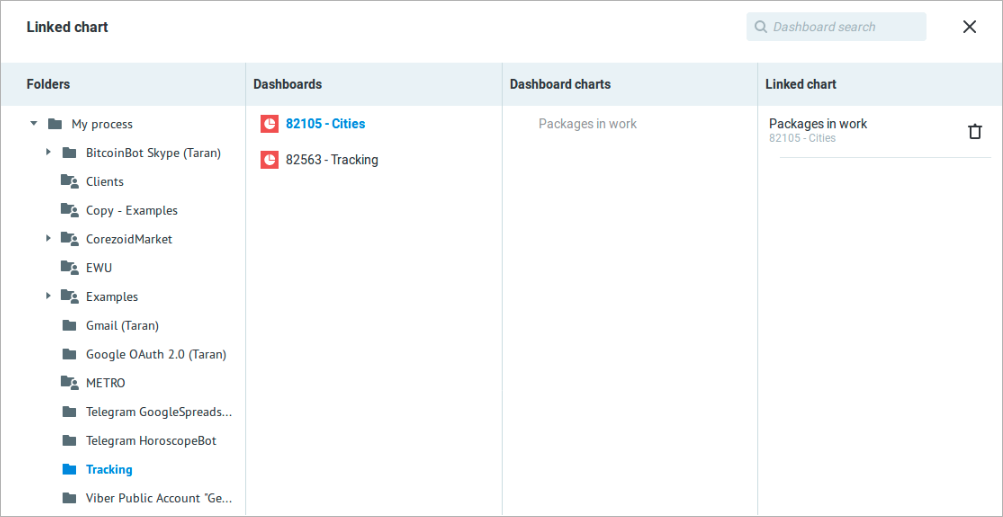
 .
.

After you’ve added the link, you can open it by clicking the corresponding metric link icon.
Was this article helpful?